Q&A Olympic Athletic Performance for Humans vs Animals - Who would Win?
Animals are excluded from the Olympics, apart the Equestrian events, which are quite frankly, degrading for animals - especially the dressage.
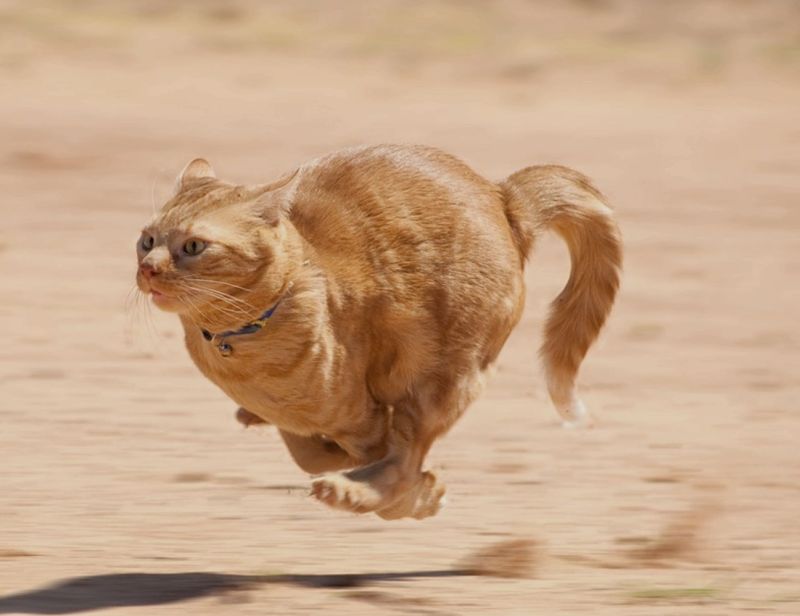
But while the athletes and swimmers bathe in the glory of their achievements, it is humbling to consider how humans would fare in human vs animal tests of Olympic athletic performance.
Well, the results may shock you, even though the animals don't train as hard as they should!
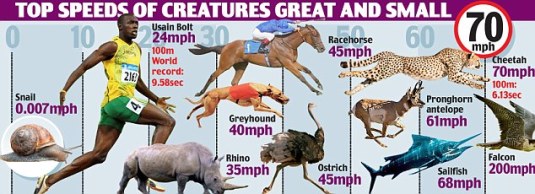
So how do human athletic abilities and performances compare with those in the animal kingdom?
The table below shows that in all the major individual athletic events the animals would win all the medals and that humans are inferior athletes to animals despite all the training that is done by Olympic athletes.
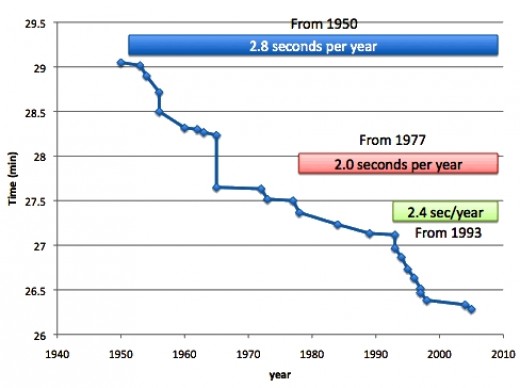
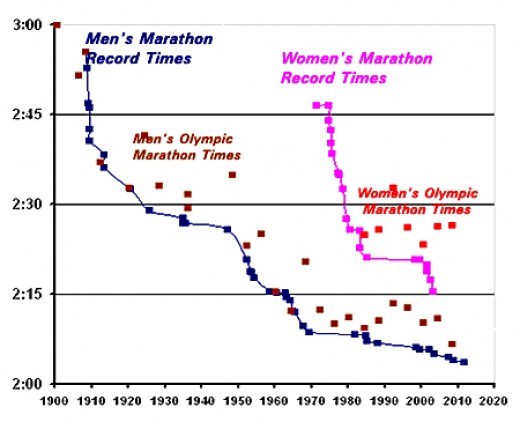
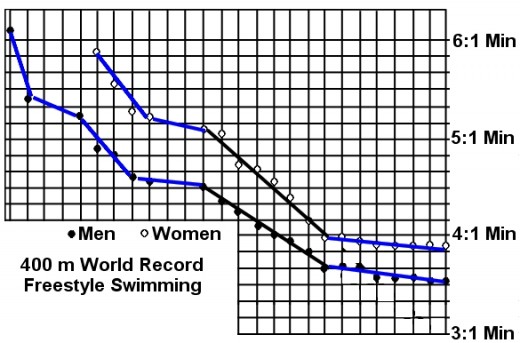
Humans have dramatically improved their performance over the last 100 years, but as the images show humans performance improvements are slowing down and are probably close to the maximum that can be achieved.
That is why humans gave adopted time measurements in hundreds of seconds. Drugs may help but they may be banned.
Human Vs Animal World Records
|
Event
|
Human Record
|
Holder
|
Animal Record
|
Holder
|
|---|---|---|---|---|
|
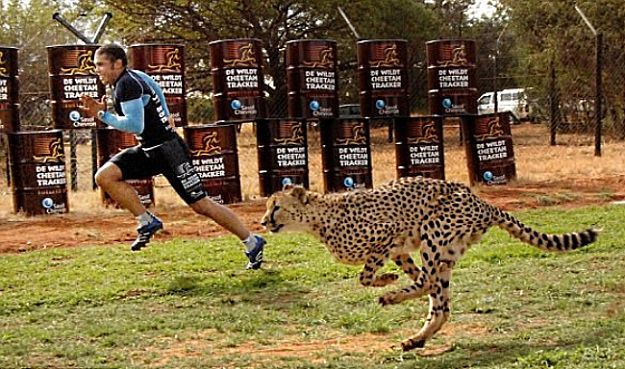
100m
|
9.58 seconds
|
Usain Bolt
|
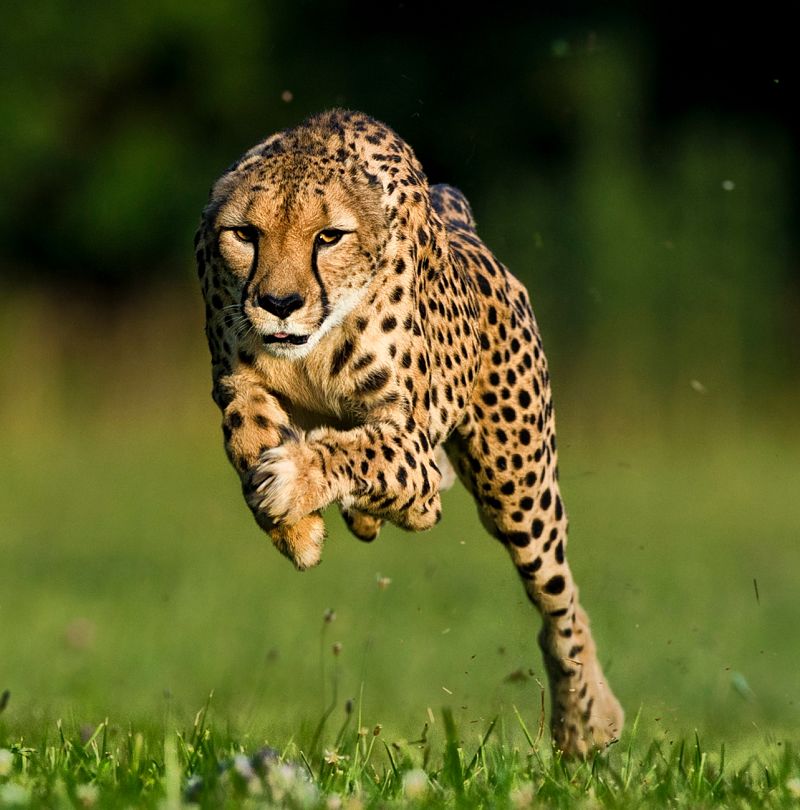
5.8 seconds
|
Cheeter
|
|
200m
|
19.19 seconds
|
Usain Bolt
|
6.9 seconds
|
Cheeter
|
|
|
|
|
9.8 seconds
|
Race Horse
|
|
|
|
|
11.2 seconds
|
Greyhound
|
|
400m
|
43.18 seconds
|
Michael Johnson
|
19.2 seconds
|
Race Horse
|
|
|
|
|
21.4 seconds
|
Greyhound
|
|
800m
|
1 min 41 sec
|
David Rushida
|
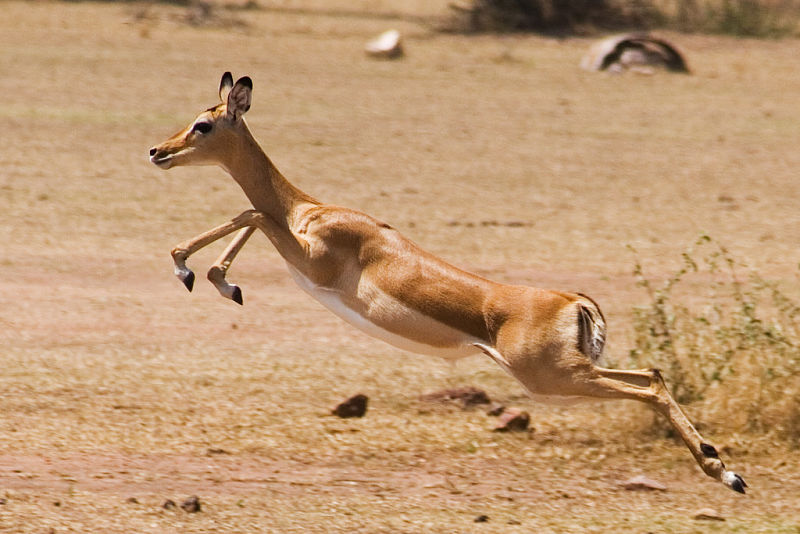
33 seconds
|
Pronghorn Antelope
|
|
|
|
|
49.2 seconds
|
Greyhound
|
|
Top running speed
|
23.4 mph (37.6 kph)
|
Michael Johnson
|
75 mph (120 kph)
|
Cheeter
|
|
|
|
|
55 mph (89 kph)
|
Pronghorn Antelope
|
|
|
|
|
55 mph (88kph)
|
Race Horse
|
|
|
|
|
43 mph (69kph)
|
Greyhound
|
|
|
|
|
22 mph (35.3 kph)
|
Dromedary camel
|
|
|
|
|
40 mph (64kph)
|
Ostrich
|
|
Flying Speed
|
Humans can't fly
|
|
161 mph (259 kph)
|
Peregrine falcons
|
|
|
|
|
64 mph (103 kph)
|
Ducks and Geese
|
|
Marathon
|
2 hours, 3 minutes and 38 second
|
Patrick Makau Musyoki
|
1 hour 18 minutes and 29 seconds
|
Horse
|
|
Long Jump
|
8.95 m
|
Mike Powell
|
12.8 m
|
Red Kangaroo
|
|
High Jump
|
2.45 m
|
Javier Sotomayor
|
3.1m
|
Red Kangaroo
|
|
|
|
|
4.0 m
|
snakehead fish
|
|
Power Output
|
80 Watts per kilo
|
|
400 Watts per kilo
|
Pheasant and Grouse
|
|
|
|
|
200 Watts per kilo
|
humingbird
|
|
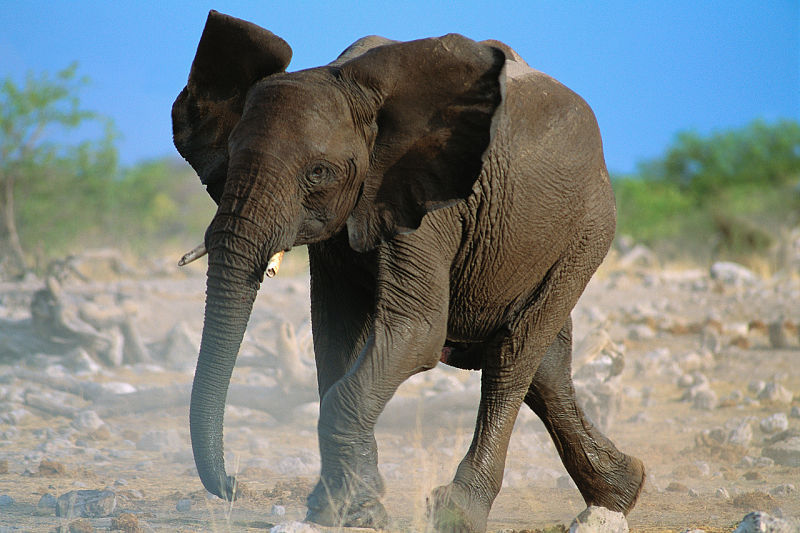
Lifting Weights
|
snatch - 216.0 kg (476.2 lb),
|
Antonio Krastev
|
300 kg
|
elephant trunk
|
|
|
Clean and Jerk - 266.0 kg (586.4 lb)
|
Leonid Taranenko
|
820 kg
|
elephant carrying
|
|
|
|
|
455 kg
|
grizzley bear
|
|
|
|
|
900 kg
|
gorilla
|
|
Swimming speed
|
5.34 mph (8.6 kph)
|
Frederick Bousquet
|
68 mph (110 km/h).
|
Sailfish
|
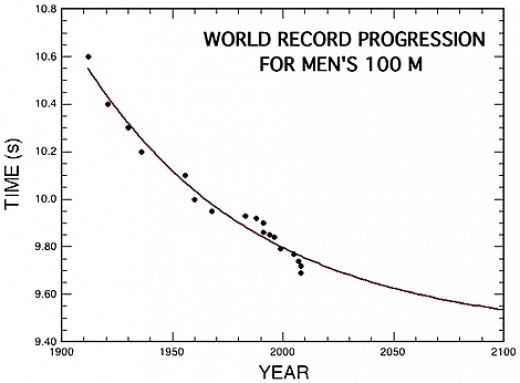
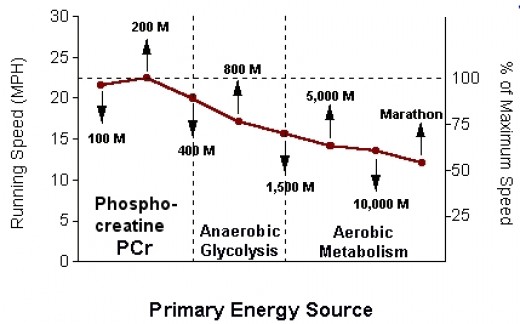
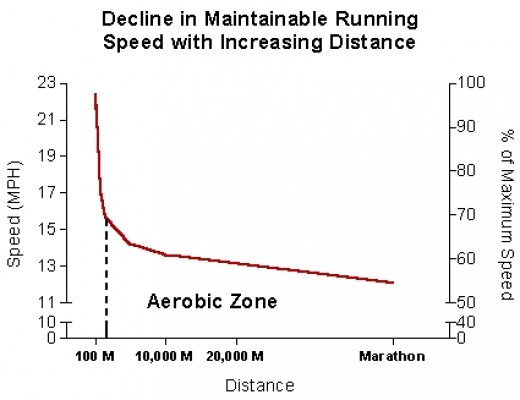
Energy Systems Used by Humans Versus Running Speed
Based on the current Olympic and world record running times, humans can maintain their maximum sprinting speed for only about 200 m. The average speeds for both the shorter distances of 100 m and 200 m world records are virtually identical (21.6 mph for 100m and 22.4 mph for 200m, about the same speed as a camel).
However, as the distance increases the average speeds decline dramatically. The average speed for the full distance of 26 miles for the marathon is only 12.1 mph, which is only about half the speed for the world record sprinting speed.
The primary reason for this is the limitation of the lungs in delivering oxygen to the muscles through aerobic metabolisms. For shorter distances the athletes cheat - they run without using oxygen. This is termed anaerobic metabolism. They firstly use the energy stored in the muscles that can be quickly used (ATP from Phosphocreatine - PCr). Next they can run their energy generating mechanisms without oxygen, but this is very inefficient and has lactic acid as a by product. Both of these forms of metabolism are very limited and don't use oxygen.
After a bout of exercise the athlete must slow down and breathe heavily to overcome what is termed an oxygen debt. That is the athlete must consume more oxygen to replenish the energy and glycogen stored in the muscles that enables the burst of speed.
The primary energy source for sprinting distances up to 400 m is PCr.
From 400 m to 1,500 m, anaerobic glycolysis is the primary energy source.
For distances longer than 1,500 m, athletes rely primarily on aerobic metabolism.